MarelTestNet
Preface
The goal of this document is to help in the usage of MarelTest_Net application. Used keyboard shortcuts are written inside brackets, like: [key], [key+key].
Introduction
MarelTestNet is a data acquisition software.
Interface
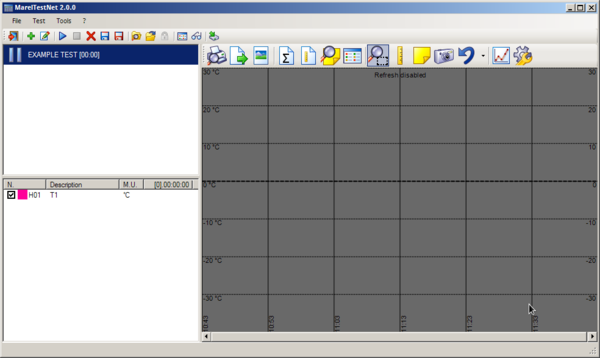
The following image is the main window of the application:
Following sections describe in detail all main window components.
Menu and toolbar
All application functions are available from menu and you can select them with mouse or with keyboard (pressing Alt + underlined letter of selected command).
In this manual, all menu to use for each particular task are given with the following schema:
Menu label ⇒ Submenu label ⇒ …
The following table contains all toolbar items, with description of each button.
Tests list
The tests list on the left, under the toolbar, shows all active and opened tests. Icon of tests indicate its states, like the following table:
Channels list
Channels list is under tests list. It contains all inputs of selected test. For each channel, in first two columns there are color and description. Third column contains the last acquired value. In column header there is the time of the test duration.
When you put vertical bars in the graph, the applications adds up to two new columns to show values and times of bars.
To show/hide a channel in the graph, just check/uncheck the channel in the list.
Graph toolbar
The graph toolbar allows the usage of all functions of the graph, like export as image, zoom, etc.
Graph
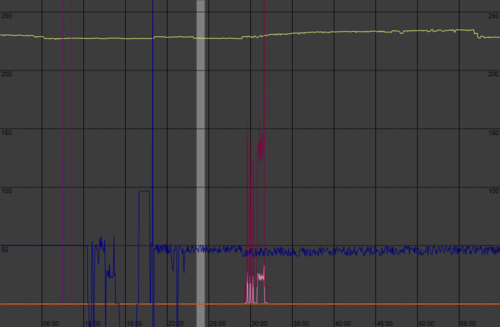
In graph there are all curves of the test probes. In the graph you can use zoom and selection bars.
Test
The term Test refers to the acquisition and storage phase of read input values. The application allows to start more concurrent tests. Tests can be saved in local archive on in other media, like removable devices.
New test [F3]
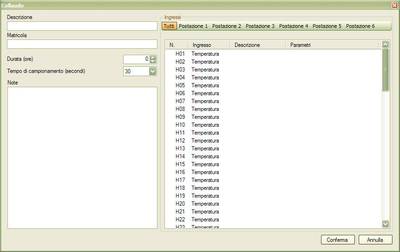
Select Test ⇒ New or press the ![]() button to open the new test window:
button to open the new test window:
Description: insert a brief description of the test.
Serial Number: this is an optional serial number of the product to test.
Lenght (hours): insert the maximum duration of the test in hours, if needed, otherwise 0.
Sample time (seconds): select the sample time in seconds for the test (available values are 1, 5, 15, 30 e 60).
Notes: optional test notes.
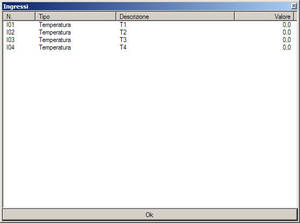
Afterwards, you need to specify the input channels to use. You need to choose a description and a color for each one. Once configuration is ready, you can press Confirm button. The application shows another window where you can see instant values of test inputs:
Inputs
Before to start a new test, you need to define in archive the channels to use.
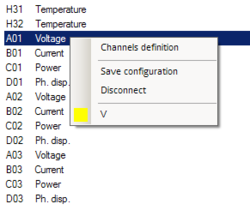
Click with right mouse button on inputs list and choose Channels definition to open the management window. See the Channels definition section of Tools chapter.
Inputs grouping
Usually, during test start, the application shows all available input channels. Those cahnnels can be split into more “virtual” places for a better interpretation. To select an input group, click with mouse over one place:
Clicking All button, you can come back to default view. You can use without problems channels from different places.
Connect a channel
Click with right mouse button on channel to connect, and select color and description from the popup menu:
Disconnect a channel
Save configuration
You can save inputs configuration to reload it in next tests:
- Click with right mouse button in inputs list;
- Select the command Save configuration;
- Input a name for the new configuration and press Ok in the next window.
Open configuration
To open a configuration, follow this procedure:
- Click with right mouse button on inputs list;
- Select Open configuration and choose the desired configuration from the popup list;
- Confirm opening pressing Ok in the next window.
Delete configuration
To delete an existing configuration, follow this procedure:
- Click with right mouse button on inputs list;
- Select Delete configuration and choose the desired configuration from the popup list;
- Confirm deletion pressing Ok in the next window.
Start acquisition [F5]
Select the test in the list and click Test ⇒ Start, or press the ![]() button.
button.
Stop acqusition [F6]
Select the test in the list and click Test ⇒ Stop, or press the ![]() button.
button.
Delete test
Select the test from the list and press Test ⇒ Delete, or press the ![]() button. Complete deletion pressing OK in the next confirmation window.
button. Complete deletion pressing OK in the next confirmation window.
Save test in archive [CTRL+A]
Use this function to save the test in local archive of the application.
- Select the test in the list;
- Confirm with Ok in the next window.
Save test in folder [CTRL+S]
You can use this function to save test data on removable devices, network drivers or different folders.
- Select the test in the list;
- Input a name for the file and select the path in the Save as window;
- Confirm with Ok button in the next window.
For each test, the application will creates two or more files with the following extensions:
| Extension | Content |
|---|---|
| .thf | XML file with test info |
| .tdf | Binary data of the probes |
| .tif | Attached images archive (optional) |
Open test form archive [F10]
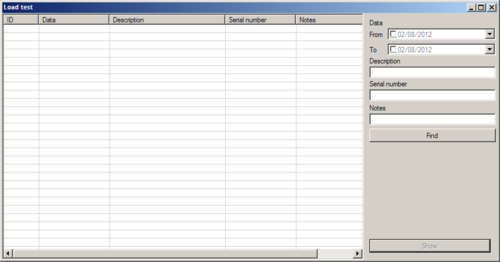
You can use this function to open a test previously saved in local application archive.
- Press the Find button to show all archived tests;
- Select the test to open and press View button to open it.
You can search and filter archived tests with the following fields:
- Date (from/to)
- Model
- Serial number
- Notes
In dates fields, you should specify the begin and the end of the search period; in other fields, you could add one or more characters to search.
Open test from folder [F11]
With this function you can open a test from a removable device, a network driver or a different folder.
- In the open dialog, find the .thf file of the desired test and press Open.
Graph tools
With this tool you can print the graph, at its current state, also if there is active zoom.
Export
This tool allows to export graph data in a text file, that you can open in external applications as Microsoft Excel® or LibreOffice Calc.
Save
Average values
This tool open a window with minimum value, maximum value, integral average and arithmetic average of all inputs of the selected test.
Bar values
Notes list
This tool opens a window with the list of all notes placed in the graph.
- The View note button allows to scroll the graph to show the page of the selected note.
- The Delete note button allows to delete the selected note.
Images list
This tool opens a window with all attached images.
- The View button allows to scroll the graph to show the page of the selected note.
- The Edit button allows to edit the note of the selected image. When edited, press the Save button to confirm the change.
- The Delete button allows to delete the selected image.
Zoom
When the zoom tool is enabled, you can select with mouse an area in the graph and enlarge it. You can enlarge again the same area with the zoom tool.
Bars
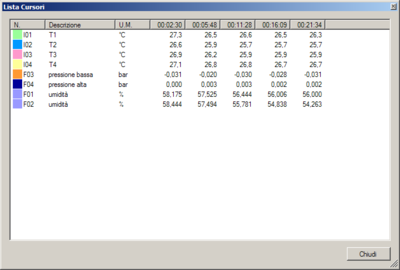
With this tool you can show test input values at the point where you click with mouse in the graph. With left click you can insert the first bar, with the right click you can insert the second one. To insert more bars, you can use the left click together with the keyboard SHIFT button.
Set a manual bar
With the two popup menu items, you can set manually the position of the bars, setting the precise time.
Notes insertion
When you click the note insertion button, you need to click a point in the graph where to add it. In the next window, you need to insert the note text and press Confirm, or press Cancel to undo the insertion.
Image insertion
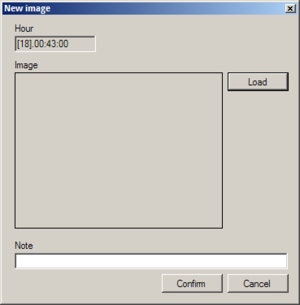
When you press the image insertion button, you need to click a point in the graph where to add it. In the next window, you need to select the image file with the Load button, insert a description note and press Confirm to complete the operation, or press Cancel to undo the insertion.
Reset
With this tool you can restore the inizial graph state (this tool undos the zoom and deletes all inserted bars).
Tools
Graph settings
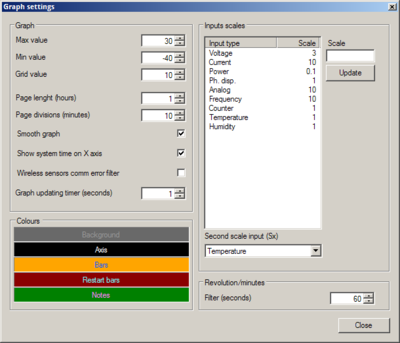
In this window you can edit all graph settings.
- Max value: maximum value of the graph.
- Min value: minimum value of the graph.
- Grid value: value of the graph grid.
- Page lenght (hours): lenght of the graph page in hours.
- Page divisions (minutes): grid divisions of the graph page in minutes.
- Smooth graph: if enabled, the graph is smooth.
- Show system time on X axis: if enabled, in graph you will see real time instead of test time.
- Wireless sensors comm filter: if enabled, it hides wireless communication holes in graph.
- Graph updating timer (seconds): the refresh time of the graph during acquisition.
- Colors (background, axis, bars, restart bars, notes): customizable colors of graph items.
- Input scales: you can customize scale for each input type.
- Second scale input: scale to show on the left of the graph.
- Revolution/minute filter (seconds): filter to apply to counters inputs.
Channels definitions
Before you create a configuration, you need to define channels to use.
- Select Tools ⇒ Channels definitions to open the following panel:
To add a new definition:
- Select New or right click with mouse on channel list and choose New from popup menu;
- Select the input type from the popup list;
- Insert a description;
- Press Update button.
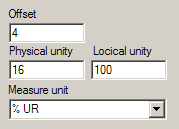
For Analogic type inputs, you need also to specify other parameters, accorting to used device:
Full Physical unit and Logical unit fields with tool generated voltage and the measured value, and write the measure unit too.
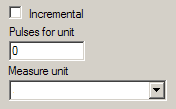
For Counter type inputs, you need to specify also if they are incremental (like liter counters) or not (like revolution counters), and specify pulses for unit and measure unit.
Input values
To view real time system inputs values, select Tools ⇒ Input values, or press ![]() button:
button:
Backup
With this tool you can make a backup of all MarelTestNet data and archives.
Select Tools ⇒ Backup to open the backup window:
Set the destination folder where copy files with Select button. To start the backup, press Start.
When backup is complete, press Close to close the window.
Program options
Virtual places
To speed up the channels configuration during the test start, you can create virtual places with a fixed number of channels. You can define more channels for each input type, except for electrical parameters: Voltage, Current, Power, Phase displacement, that are assigned separately to each place.
PM300 Configuration
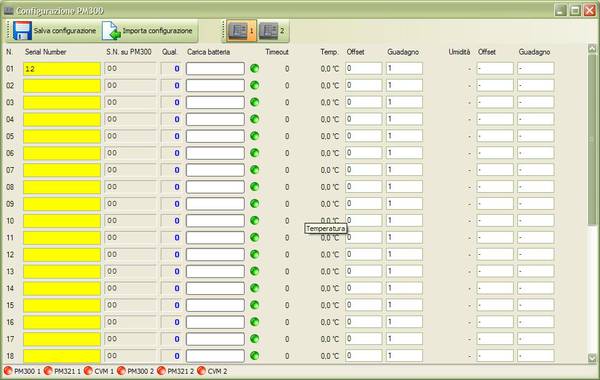
Select Tools ⇒ PM300 Configuration to open the PM300 setup window:
In toolbar, you can use ther following buttons:
| Icon | Label | Description |
|---|---|---|
| | Save configuration | Save serial numbers into PM300 memory |
| | Import configuration | Load serial numbers from PM300 memory |
There is a button for each PM300 in the system:
PM300 and its attached devices communication statuses are shown on bottom statusbar:
All wireless probes are listed in central part of the window. For each probe, it's listed:
| Text | Description |
|---|---|
| N | Wireless probe number |
| Serial Number | Text entry for probe serial number (it is written on probe label). If the background color of the entry is yellow, the value is different from the one saved in PM300 |
| S.N. on PM300 | Serial number saved on PM300 memory |
| Qual. | Wireless signal quality. An higher values means excellent quality. |
| Battery level | Probe battery level. |
| Timeout | Elapsed seconds from last communication. The value is from 0 to 255, when the maximum is reached, the probe is considered in communication error |
| Temp. | Latest read temperature |
| Offset / Gain | Offset and gain for the temperature value |
| Humidity | Latest read humidity (not available) |
| Offset / Gain | Offset and gain for the humidity value (not available) |
Replace a wireless probe
To replace a wireless probe, follow this procedure:
- click on the Serial Number text entry of the removed probe;
- write the new Serial Number (as reported in the probe label);
- press Save configuration
Remove a wireless probe
To remove a wireless probe, follow this procedure:
- click with mouse into the Serial Number text entry of the probe to remove;
- clear the text content;
- press Save configuration


