
CQ_FX WIFI
Introduction
![]()
CQ_FX WIFI is an application that was created to test product reliability by displaying the values recorded on a graph.
The main features of the application are:
- management of different types of products (washing machines, dishwashers, ovens, hobs, etc.);
- product archive management;
- test sequences management;
- test cycle customization;
- activities interval planning;
- grouping of test product to start more cycles together;
- tests archive management with search keywords like date, model, project number, etc.;
- sampling time may be set as required;
- inputs customization for each place;
- graphical analysis tools (zoom, bars);
- export of values in text format;
- export of graphs to image files;
- graph print function (whole page or zoom);
- calculating the minimum, maximum and average values.
- report of the executed cycles;
- EXCEL ® report of the executed cycles with notes and attachments.
Unlike the CQ_FX standard version, the CQ_FX WIFI software provide the management of the test cycles through one ore more mobile devices (read the CQ_FX Mobile software manual).
Setup and Configuration
Installation is available through setup file. It will install also the following Microsoft required components:
- Microsoft .Net Framework 2.0 or higher version;
- Microsoft SQL Express 2005 or higher version (required only for server version).
Onche the setup is completed, you need to edit the configuration file before to start the application.
Configuration File
The “CQ_FX.exe.config” file, in the same folder of “CQ_FX.exe” binary, can be changed with Notepad or Wordpad.
You can see an example of the configuration file (description of keys is not available, given that this is a technical file):
<?xml version="1.0" encoding="utf-8" ?>
<configuration>
  <appSettings>
    <add key="COLLAUDO" value="A"></add>
    <!-- Imposta la lingua del collaudo ("it","en") -->
    <add key="LINGUA" value="it"></add>
    <!-- Stringa di connessione al database ("Data Source=#SERVER#;Initial Catalog=#DATABASE#;User ID=sa;Password=#PASSWORD#") -->
    <add key="SQL_SERVER_CONNECTION" value="Data Source=(local)\SQLEXPRESS;Initial Catalog=CQ_FX;User ID=sa;Password=marel"></add>
    <!-- Percorso dell'archvio -->
    <add key="PATH_ARCHIVIO" value="..\ARCHIVE"></add>
    <!-- Percorso della directory di lavoro -->
    <add key="PATH_DATI" value="..\data"></add>
    <!-- Percorso della directory delle foto -->
    <add key="PATH_LAVORO" value="..\work"></add>
    <!-- Percorso della directory delle foto -->
    <add key="PATH_FOTO" value="..\IMAGES"></add>
    <!-- Identificazione sistema -->
    <add key="NOME_SISTEMA" value="Laboratorio Debug"></add>
    <add key="NOME_CLIENTE" value="MAREL srl"></add>
    <!-- Impostazioni di comunicazione moduli PM110-->
    <add key="COM_PM110" value="0"></add>
    <!-- Modalità collegamento ingressi PM110: 0=continui, 1=come moduli ADAM, 2=separati per ognli linea-->
    <add key="PM110_INPUTS_MODE" value="2"/>
    <!-- Parametri di comunicazione moduli ADAM-->
    <add key="COM_ADAM5000" value="0"></add>
    <add key="ADAM_BAUDRATE" value="57600"></add>
    <add key="ADAM_CHECKSUM" value="1"></add>
    <!-- Porte di comunicazione moduli di acquisizione delle grandezze elettriche -->
    <add key="COM_C_ENERGETICO" value="0"></add>
    <add key="COM_CBS_4C" value="0"/>
    <add key="CBS_4C_BAUDRATE" value="57600"/>
    <add key="CBS_4C_MAX_INGRESSI" value="3"/>
    <!-- Numero linee (controllo energetico) per seriale di comunicazione (=0 una sola linea seriale)-->
    <add key="N_LINEE_COM_C_ENERGETICO" value="0"></add>
    <!-- Impostazioni PhoenixContact -->
    <add key="PHOENIXCONTACT_ENABLED" value="0"/>
    <add key="PHOENIXCONTACT_UPDATE_TIME" value="200"/>
    <!-- key="PHOENIXCONTACT_CPU_XX" value="xxx.xxx.xxx.xxx,slot" -->
    <add key="PHOENIXCONTACT_CPU_01" value="192.168.1.101,20"/>
    <!-- Intervallo di aggiornamento degli ingressi -->
    <add key="TEMPO_ACQUISIZIONE_MINIMO" value="1"></add>
    <!-- Impostazioni di visualizzazione 0,1,2,3,4-->
    <add key="MODO_VISUALIZZAZIONE_LINEA" value="1"></add>
    <add key="POSTAZIONI_RIGA" value="10"></add>
    <!-- Imposta lo stato di VoltageManager_FX ("0","1","2") -->
    <add key="VoltageManager_FX" value="0"></add>
    <!-- Indica se sono attive le verifiche ("0","1") -->
    <add key="VERIFICHE" value="1"/>
    <!-- Contagiri su PM110=0 o PhoenixContact=1 -->
    <add key="REVOLUTION_INPUTS_MODE" value="1"/>
    <!-- Abilita/Disabilita scambio dati su pipe-->
    <add key="PIPE_ENABLED" value="1"/>
    <!-- Abilita/Disabilita condivisione ingressi linea-->
    <add key="LINE_INPUTS_SHARED" value="1"/>
    <!-- Abilita il monitoraggio e imposta gli schermi -->
    <add key="MONITORS" value=""/>
    <!-- Abilita/Disabilita server UDP -->
    <add key="UDP_SERVER_PORT" value="10000"/>
    <!-- IP Server remoto in configurazione monitoragggio -->
    <add key="UDP_SERVER_IP" value=""/>
    <!-- Numero cicli scheda predefinito -->
    <add key="NUMERO_CICLI" value="240"/>
    <!-- Parametri di comunicazione moduli ICPDAS-->
    <add key="COM_ICPDAS" value="0"></add>
    <add key="ICPDAS_BAUDRATE" value="115200"></add>
    <add key="ICPDAS_CHECKSUM" value="1"></add>
    <!-- Richiesta login operatore ("0","1") -->
    <add key="LOGIN_OPERATORE" value="1"></add>
    <!-- scanner.dat -->
    <add key="COM_SCANNER" value="1" />
    <add key="SCANNER_BARCODE_SETTINGS" value="20,1,11,12,9,16"/>
    <add key="IMPORTA_FOGLIO" value="[Foglio1$]"/>
    <add key="IMPORTA_COLONNA_CODICE" value="[Codice Modello]"/>
    <add key="IMPORTA_COLONNA_DESCRIZIONE" value="[Descrizione Modello]"/>
  </appSettings>
</configuration>
First Start of the Application
Start the application with a double click on “CQ_FX” desktop icon, or selecting the following option from the Windows Start menu:
Once the application is started, you need to configure manually linees and places, as described in the following paragraph.
Testing Area Configuration
Lines and places configuration is saved in SETUP.MDB database. Also if configuration is described in this manual, all features are password protected to avoid changes that can damage program operations.
Lines and Places Configuration
Select Tools → Configure from menu, and insert the password to open the following window:

Lines Configuration
For each line, you need to enter the following information:
- Temperature Sensors: ambient temperature, water temperature, …;
- Himidity Sensors: ambient humidity sensors;
- Pressure Sensors: water, gas, pressure sensors, …;
- Analog Inputs: customizable analog inputs;
- Digital Inputs: digital inputs for faults;
- CPU Modules: number of CPUs for the line;
- Line Identification eventual identification string used in the synoptic.
To add a line:
- Press New button and insert the required data;
- Confirm with Update button.
To edit a line:
- Select the line and edit data;
- Confirm with Update button.
To delete a line and all associated places:
- Select the line to delete;
- Press the Delete button.
Places Configuration
You can create places after you have created at least one test line.
For each place, you need to enter the following data:
- t type Thermocouples: thermocouples of t type;
- k type Thermocouples: thermocouples of k type (resistant to high temperatures);
- Revolutions counter: number of revoultion counters inputs;
- Water counter: number of counters for water usage;
- Analog inputs: custom analog inputs;
- Energy module: used device to read electrical quantities;
- Differential input: device to read leakage currents;
- Module and phase index: module and phase index to read electrical quantities;
- Place identification: eventual identification string used in the synoptic.
To add a place:
- Press New button and insert the required data;
- Confirm with Update button.
To edit a place:
- Select the place and edit the required data;
- Confirm with Update button.
To remove a place:
- Select the place to delete;
- Press Delete button.
To create a new place copying an existing one:
- Select the place to copy;
- Press Copy button.
System Calibration
System calibration must take place in the following cases:
- Installation of the application
- Replacement of acquisition devices
However it is suggested to perform periodically a test of acquired measures, and if you have troubles, perform a new calibration.
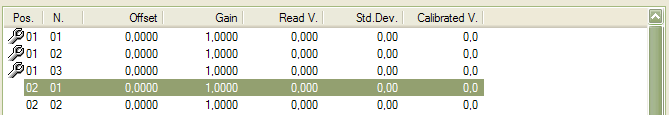
Select Tools → Calibrate from the menu and insert the password to open the following window:

Calibration consists of setting of offset and gain values to apply to channel reads. Values can be set in automatic way or manually inserted by the user.
Manual calibration of single channel
- Select the line;
- Select the input type;
- Select in the list the channel to calibrate;
- In the Manual calibration bottom box insert the offset and gain values, and confirm with Update button.
Automatic calibration procedure
Automatic calibration procedure is available only with a external calibration tool, that is a tool linked to inputs to calibrate can generates currents to simulate different values. To obtain good results, it is suggested to use a certified tool, stabilized in the ambient temperature before to start the calibration.
- Link the calibration tool to the inputs to calibrate;
- Select the line;
- Select the input type;
- Enter the two calibration extreme values;
- Enable the Standard Dev. option to acquire automatically the value after two readings with a gap less then the planned value;
- Select the channels in the list with a mouse double click, or highlight the channels by pressing and holding and after press the Select button. Selected channels are highlighted with a “wrench” icon.
- Simulate the first value with the calibration too, and press the Start button and next Enter in the confirm window;
- Without the Standard Dev. option enabled, press Confirm to accept the first value;
- Wait until the application shows the second message, simulate the second value with the calibration tool and press Enter again;
- Without the Standard Dev. option enabled, press Confirm to accept the second value;
- Onche the end message is shown, press Enter and after the Save button to save the new calibration into the application database.

Anytime you can press the Cancell button to stop the calibration procedure. To calibrate other channels, repeat the previous procedure from point 6.
Closing the Program
Select the File → Quit from the menu bar, or press the following toolbar button, and answer Yes to the next confirm message to close the application.

User Interface
At start, the application shows the main screen with menu, toolbar and the synoptic with the lines and the places.
Main Screen
The following image shows the main screen of the application:

The upper panel shows the application title and the three buttons to minimize, maximize and close the application. Next to the upper panel you have the menu bar and the tool bar.
The central panel shows all test lines and places. The layout of lines and places is set in the configuration file.
The bottom panel contains the status bar, which contains some brief information about the application.
In the following paragraphs there is the detailed description of each main screen component.
Menu Bar
All application features are available through the menu bar. You can access to them with the mouse or holding the Alt key and pressing the underlined letter of the desired command.

For each feature, it will be listed which menu to use to open it, based on the following schema:
Toolbar
The toolbar contains a list of buttons to open quickly the most common features:
| Tasto | Descrizione | |
|---|---|---|
| | Close the application | |
 | Operator login | |
 | Operator logout | |
 | Open the event log | |
 | Stop the notification sound | |
 | Move to the next place in test cycles display | |
 | Move to the previous place in test cycles display | |
 | Enable/disable grid layout in test cycles dysplay | |
 | Close the test cycles display and open the main screen | |
 | Open a test from archive | |
 | Create a new test in the current place | |
 | Edit data of the current test | |
 | Save in the archive all test data and free the place | |
 | Delete the current test and free the place | |
 | Start an acquisition cycle | |
 | Break an acquisition cycle | |
 | Close an acquisition cycle | |
 | Delete the latest acquired cycle | |
 | Open the test cycles display | |
 | Print the test card | |
 | Print the test report | |
⇓  | Print the test Excel report | |
 | Print the test Excel report preview | |
 | Copy a place | |
 | Move a place | |
 | Show the inputs values of the place | |
Statusbar
The status bar shows:
- the latest error message (if present);
- the status of the UDP server for the Datalogic Elf mobile devices;
- the status of the serial connection for the Datalogic Dragon barcode readers;
- the name of the logged operator (if present);
- system datetime.
Lines and Places Display

In the central panel there are all configured places, divided by lines. For each place you have:
- an icon, based on the product type in test;
- the model string;
- the ID of the place;
- a led icon with the cycle status:
 | No cycles |
 | Cycle running |
 | Cycle stopped |
 | Cycle completed |
- it the verifies option is enabled, there is also the status of the latest verify in the place box:
 | Running verify |
 | Verify result positive |
 | Verify result negative |
Select a Place
To select a place, click on the panel with the left mouse button. The selected place is highlighted with a red border.

Select More Places
You can also select more places, if they have same Group. Click on a single place holding the Shift key.

Test Management
To start a new test, you need to enter the data of the product to check, select the card with all cycles to execute and configure the inputs to use to read values.
Anytime you can change test data of the product, or change the test card to use. In the following paragraphs, there is described all the procedure starting from the test creation to the saving in archive in the end.
Start a Test
Select with the right mouse button an empty place and select Place → Load to open the new test window.
To start quickly a test, with a minimum insertion of required data, follow these steps:
- Open the archive to select the product model with the Load button in the Product box;
- Select the Card tab;
- Press the Load button to open the test cards archive;
- Press the Confirm button to completethe procedure and come back to main screen.
To enter all test data, read the following paragraphs that describe the following information:
- Data;
- Card;
- Inputs.
Test Data
In the Test box you need to enter all the general information about the test:
- Line/Place: ID of selected line/place;
- Date/Time: date and time of the test start;
- Card number: useful field for the following archive search;
- Sample time: sample time of the read values (available values: 1, 2, 5, 10, 15, 30 or 60 seconds);
- Serial number: registration number of the product;
- Project/Line: user field for the following archive search;
- Group: useful field to group places to do a multiselection in the main screen;
- Tipo collaudo: selezionabile tra SOFT TOOL/AUDIT ecc…;
- Note: free text field;
In the Product box you have the information about the product in test. You can load them from the archive, and if needed, change them in the box to make changes only for the current product.

Test Card
In this panel you can choose the test card with the cycles sequence to follow in the entire product test. After the card is selected, you can make local changes in the panel (without make changes to the archived one) about cycles and activities.

To load a card from the archive:
- Press the Load button;
- Highlight the desired card in the archive and press the Select button.
Once the card is loaded, all programs and activities will be listed in their lists.
Card Programs
Anytime you can edit the inserted programs in the test card. You can freely add new programs, but you can remove an inserted program only if you havent used it during in a test cycle.
To add a program:
- Press the Add button;
- Select a program from the existing ones or create a new one (read the Programs paragraph) and press Select button.
To edit a program:
- Select the program in the list;
- Press the Edit button;

Card Activities
Anytime you can add activities (like the programs), and you cant remove them if you have test cycles with the activity confirmed.
To add an activity:
- Press the Add button;
- Select one activity from the existing ones, or create a new one (read the Activities paragraph) and press the Select button.
To edit an activity:
- Select the activity in the list;
- Press the Edit button.

Test Inputs Configuration
All channels uses to create the graph of acquired values are listes in the Inputs tab. Based on product type, you can have voltage, current, power, temperature, liter counters, revolutions counters, etc… inputs types.

For each input you have the following information:
- N. : number of the channel based on place and type;
- Description : channel description string;
- Opt. : parameters for engineering;
- Line : ID of the line;
- Place : ID of the place;
- Type : type of the channel (t temperature, k temperature, rev counter, liter counter, etc…).
You can use also the line inputs (this will be described in the following paragraphs), shared between all places, and also the inputs of the other places in the same line.
Edit Inputs Configuration
If you press Edit button, you'll open the window to change the used inputs.

The window will shows the Place Inputs as default view, where you can find all inputs of the place. Used inputs have color and description. If you select Line Inputs, you'll see the shared inputs of the place line (like ambient temperature or humitidy temperature, gas pressure, etc.).
To link a channel:
- Select the channel in the left list;
- Select in the right list the color and the description to use;
- For some types of input, you need to enter some additional information:
- Revolution counter: insert the number of pulses for each revolution, according to used device;
- Analogic: insert offset and gain, according to used device, or click Calibrate button to do an automatic calculation;
- Press the Connect button.
To unlink a channel:
- Select the chanel in the left list;
- Press the Disconnect button.
With the selection feature on the bottom left, you can move between places of the line, to use the free inputs of the other places.
Only for the input of the same places (not for the shared inputs), you can load a previously defined configuration in archive.
To load a configuration:
- Press the Load button;
- Select the configuration;
- Press the Select button.
Edit Test Data
Anytime you can change test data (edit product details, edit programs and activities of the test card). You can also change the sample time and change inputs configuration for the next cycles.
To open the edit panel, click the place with the mouse right button and select Place → Edit in the context menu.
Test Cycles
By the “cycle” term it is identified an interval of acquisition of data that can be associated with the execution of a particular program in the product in test. For all the test duration, you can start, break or close more cycles in a sequential manner.
Start a Cycle
To start a cycle, and together the data acquisition, follow this procedure:
- Select the place with the right mouse button and select Place → Cycle → Start in the context menu;

- In the next window, you need to enter all parameter for the new cycle:
- In the upper textbox there is the name of the latest executed cycle. Pressing the Details button you can open a new window with all the details of the latest cicle.
- Select the desired program from the all card programs list. The recommended program to run, following the card sequence, is already checked. In the list, for each program are listed: description, type, temperature, cooking time, duration and notes.
- Check the confirmed activities. The list shows the activities to execute in the cycle, as set in the test card..
- To show all the activities of the test card, press the Show all button.
- To skip an activity and postpone it to the next cycle, select the activity and press the Skip activity button.
- To confirm all planned activities, press the Confirm all button.
- If the selected program contains ona or more functions, you can set the desired value in the following list. Once selected the function, you can set the default value with the button on the right, or change the value in the textbox; press Ok to confirm or Default to make the current value as default for the previous cycles.
- If you check the Ignore maximum duration option, the cycle will not stop when it will reach the program duration.
- If you check the Modify cycle data, when you press Confirm in the window, you'll have another window to change the details of the new cycle, like:
- Description, type, temperature, cooking time, duration and notes of the program.
- Function values.
- View the current verifies. For each verify you can see type, probe and temperature.
- Press the Confirm button to save the changes.
- If you check the Restart test sequence, and if you checked a different program than the planned one, starting from the next cycle the test sequence will change continuing from the current program.
- Press Confirm button to start the cycle.
Break a Cycle
If you need to repeat the current running cycle, you can break it and start it again.
To break a cycle:
- Select the place with the right mouse button and select Place → Cycle → Break from the context menu.
The stopped cycle will be overwritten by the next cycle or you can delete it with the delete function, described in a following paragraph.
Close a Cycle
Cycles with a duration different than 0 will be closed in automatic when the duration is reached. Instead, you need to close manually the cycles without a maximum duration.
To close a cycle:
- Select the place with the right mouse button and select Place → Cycle → Close from the context menu.
Delete a Cycle
To delete a closed or stopped cycle:
- Select the place with the right mouse button and select Place → Cycle → Delete from the context menu.
Each deletion, the cycles counter is decreased, and you can continue to delete the last cycle.
Test Cycles Display
Once you have selected a place, you can open the test cycles display with one of the following ways:
- Click the place with the right mouse button and select Place → View from the context menu;
- Press F4 key;
- Press this button on toolbar:

A new window will shows the list of the cycles and shows the graph for each cycle and its details.

The window contains:
- a toolbar;
- on the left, the list of the cycles, the list of the probes and some data of the selected cycle
- on the right, the graph of the selected cycle.
Cycles List
The list contains all executed cycles of the selected place, with a progressive number, the date and the time, and the name of the program.

Probes List
This list contains all probes of the cycle, with the color and the description of each one in the first two columns.
In the next column, you have the value of the latest read. In the column header you have the time of the read. If you enable the bars tool (read the following paragraph), this column is divided in two columns, where you can find the values in the bars positions.

To show/hide a probes in the graph, you can click with the mouse in the checkbox on the left.
Cycle results
This list contains some data of the selected cycle: total duration, Kwh consumption, water consumption in liters. Consumptions are available only if there are appropriate probes.

Graph
The graph shows the curves of the acquired data of the input probes. In the upper statusbar there are the ID of the line and the place, and the model string of the product.

Toolbar
In the toolbar you have available all the features of the graph:
| Toolbar button | Description |
|---|---|
| | Print the graph |
| | Export the data of the graph in a text file |
 | Save the graph as image (jpeg or bitmap) |
 | Force a white background in the saved images |
 | Attach the graph in the cycle report |
 | Show medium values of the cycle |
| | Zoom tool |
 | Bars tool |
 | Event tool |
 | Clear the graph and restore the default view |
 | Delete the inserted bars |
 | Show the values of the inserted bars |
 | Divide the cycle |
 | Move to the previous cycle |
 | Move to the next cycle |
 | Customize the graph settings |
 | Edit the cycle data |
 | Edit the cycle notes |
 | Show all inserted events |
 | Show all attachments |
 | If verifies are enabled, set the positive result |
 | If verifies are enabled, set the negative result |
Some of these tools are described in the following paragraphs.
Zoom Tool
Use the following button to enable the zoom tool:
To enlarge a part of the graph, click with the left mouse button on the first point, and hold the button until the second point, then release it.

Bars Tool
Use the following button to enable the bars insertion tool:
You can put two vertical bars on the graph: one with the left button and the other with the right one. In the probes list, the latest column is divided in two columns, one for each bar. The column headers will contain the time of the read in the bar location. The consumptioms are updated with the usage in the period between the two bars.

If you hold the SHIFT button, you can insert a list of bars, creating a list of values. You can print this list.
Event Tool
You can use the following button to enable the event insertion tool:
Click the point in the graph where to insert the new event. In the next window, you can add a description of the event. Press the Confirm button to complete the insertion.
Attachment Tool
You can use the following button to insert the shown graph as attachment of the current cycle:
In the next window you can insert eventual notes. Press Ok to complete the insertion.
You can use the following button to show the list of the existing attachments for the current cycle:
In this window you have all inserted attachments. For each attachment you have the date and the time, and the notes.

- Press the Edit note button to change the notes of an attacchment. Press the Save note button to save the changes;
- Press the Delete button to remove an attachment.
Default View Tool
With the following button:
you can restore the graph to the initial default view. This feature is useful to clean the zoom tool or the inserted bars. You can also use the right mouse button to clean the graph.
Bars List Tool
With the following tool:
you can see the acquired values of the inserted bars.

Bars Deletion Tool
You can delete all inserted bars with the following button:
Cicle Divide Tool
You can enable this tool with the following button:
With this tool you can divide the cycle according to the first bar position. All data after the first bar is moved into a new cycle. You can use this tool more times.
Cycle Selection Tool
With the following buttons:
you can select the previous or the next cycle. These buttons are useful when you are viewing more places at the same time.
Graph Options Tool
The following button allow you to change the graph options:
In this window you can change:
- Minimum and maximus viewable values;
- Sub-division value of the horizontal grid;
- Lenght of each page in hours;
- Sub-division value of the vertical grid;
- Graph smoothing;
- Revolutions/minute filter for revolutions counter;
- Colors of the graph (background, axis, bars, notes and verifies);
- View scale of each input type. Select the input type on the list, change the value and press the Update button to confirm;
- Input type to use a second scale.

Press the Close button to save the changes.
Cycle Data Tool
To read/change the cycle data, press the following button:
In this window you can change the name, the temperature, the notes, and the custom fields of the program. You cant change the duration.

Cycle Notes Tool
Use the following button to use the cycle notes tool:
Press the Confirm button to apply the changes, or Undo to cancel.

Grid View
With the grid button you can enable/disable the view of more places at same time. If you have selected more places of same group, you'll see all places of that group, otherwise you'll see all places of same line. In the grid view, the lists of probes, cycles and results are related to the places with the green sign.

You can move between places with the two buttons Previous and Next of the main toolbar.
You can see the Test Cycles Display with the grid view enabled:

Delete a Test
If you like to free a place, and delete all test data without archive it, you need to delete the place.
To delete a test:
- Select the place with the right mouse button and select Place → Delete from the context menu;
- Press Yes in the confirmation window;
- You need to enter the current date as password (ddmmyyyy format).
Archive a Test
Saving a test, all test data will be stored in the archive (all cycles, all acquired values, graphs, etc, …). You can open a saved test from the archive when you need to see it; all analysis and print tools will be available for saved tests also.
To save a test:
- Select the place with the right mouse button and select Place → Save from the context menu;
- Press Yes in the next window and wait until the saving is complete;
- Press Ok to close the window and come back to places synoptic.
Move a Test
You can move a test across places, also on a different line.
To move a test:
- Select the place with the right mouse button and select Place → Move from the context menu;
- Select witht the left mouse button a free place (green box).
- Press Yes in the next window.
Tests Archive
In the following paragraphs there are described all features of the tests archive.
Tests Research
To access to tests research, select Archive → Tests from the menu bar, or use the following button of the toolbar.
The following window is the tests archive screen:

From the right panel, you can use the following fields to improve the research:
- Test number;
- Product type;
- Product fields: customizable product fields;
- Test date: date interval (referring to the test start date);
- Test notes;
- Product code;
- Model;
- Product notes;
- Serial Number;
- Project/Line;
- Card number.
To find a test in the archive:
- Enter the desired values in the research fields;
- Press the Find button.
View a Test
Once you find the desired test:
- Select it in the tests list;
- Press the Load button.
The test cycles display will be open, in the same way of an active place. Closing the screen, the test will be closed.
Delete a Test
Once you find the desired test:
- Select it in the tests list;
- Press Delete button to remove the test from the archive.
General archive
The database of the program CQ_FX_WiFi has been defined for managing the following typologies of elements:
- Product types;
- Products, Campi prodotto: for the management of the registry products;
- Cards, Program types, Programs, Functions, Activities: for the management of the testing cycles;
- Inputs, Configuration inputs: per la gestione degli ingressi.
- Operators: for the management of the testing operators.
Product types
All the elements in the archive : testing cards, inputs configurations, products, etc… are grouped for Product Type, therefore the creation is fundamental.
To open the management window select Archive - > Product types from the menù :

The information that characterize each element are :
- Product type : descriptive field that gathers a typology of products: LVB, LVS, DW, Oven …;
- Image : 48×48 gif image that is visualized in the main synoptic.
To add a new product type:
- Press the New button;
- Insert the product type and load the image with the
 button;
 - Press the Update button to confirm.

To modify an existing product type:
- Select the product type into the list;
- Modify the product type and if necessary also load the new image with the button;
- Press the Update button to confirm.
To delete an existing product type:
- Select the product type into the list;
- Press the Delete button to confirm.
Product Fields
In the archive window of the product fields is possible to manage the user defined fields grouped by product type to characterize the products. They will be useful for search the products into the archived tests.
To open the management window select Archive → Product fields from the menù:

To add a new personalized field:
- Select the Product type;
- Press the New button;
- Insert the personalized fields identification;
- Press the Update button to confirm.
To modify an existing personalized field:
- Select the Product type;
- Select the element to modify from the list;
- Modify the text;
- Press the Update button to confirm.
To delete an existing personalized field:
- Select the Product type;
- Select the element to delete from the list;
- Press the Delete button.
Products
In the archive window of the product is possible to manage products grouped by product type. There are some fixed fields that are common to all typologies of products and other that can be personalized in the description.
To open the management window select Archive → Pruducts from the menù.

For each product must be supplied the following informations:
- Product code: the code of the product as mentioned in the barcode.
- Model: the description of the product.
- Note: Eventuali note relative al prodotto.
- Product fiels: Personalized fields to specify additional informations. Please see next paragraph.
To add a new product:
- Select the Product type;
- Press the New button;
- Insert the pruduct informations;
- Press the Update button to confirm.
To modify an existing product:
- Select the Product type;
- Select the element to modify from the list;
- Modify the informations;
- Press the Update button to confirm.
To delete an existing personalized field:
- Select the Product type;
- Select the element from the list;
- Press the Delete button.
Assign Customized Product Fields
In the product archive you can also assign for each inserted model, the value of the custom fields.

Please follows these steps:
- Select the Product type;
- Select the product to modify;
- Select the custom field;
- Insert or remove the value into the text field;
- Press the Ok button.
Program Functions
A function means an option that can be enabled at the start of a cycle associated with a program. For example, it may be defined as the activation of a function key that affects the characteristics of a program, whether it be cooking and washing etc. …
To open the management window select Archive → Functions from the menù.

To add a new function:
- Select the Product type;
- Press the New button;
- Insert the function name;
- Press the Update button.
To modify an exixting function:
- Select the Product type;
- Select the element to modify;
- Modify the name of the function;
- Press the Update button
To delete an exixting function:
- Select the Product type;
- Select the element to delete;
- Press the Delete button.
Program Types
For type program we mean a basic description to associate with more programs of the same type. For example, most programs cooking or washing at different temperatures but with the same characteristics must belong to the same type: grill static cotton, wool etc. … The program types are used in the printing of the report to Excel ® where they will be listed and assigned automatically to a letter of the alphabet to provide a summary report of all cycles.
To open the management window select Archive → Program types from the menù.

To add a new program type:
- Select the Product type;
- Press the New button;
- Insert the program type name into the text field;
- Press the Update button.
To modify an exixting program type:
- Select the Product type;
- Select the element to modify;
- Modify the text;
- Press the Update button
Per modificare un tipo programma:
- Selezionare il tipo di prodotto;
- Selezionare nella lista l'elemento da modificare;
- Modificare il testo;
- Premere il pulsante Aggiorna.
To delete an exixting program type:
- Select the Product type;
- Select the element to delete;
- Press the Delete button.
Programs
The program is the kind of the cycle choosed at the start of the cycle during the test process.
To open the management window select Archive → Programs from the menù.

For each program must be supplied the following informations:
- Name: Program name as reported in the machine;
- Temperature: The temperature to apply onto the product in the program selection;
- Tempo di cottura: The time to apply onto the product in the program selection;
- Acquisition duration: The cycle time preset. If you enter '0 ', the cycle will not have a maximum;
- Note: Additional notes for the program.
- Personalized options: A number of other customizable fields in which the operator can define the functions.
To add a new program:
- Select the Product type;
- Press the New button;
- Inserirt the requred informations;
- Press the Update button.
To modify a program:
- Select the Pruduct type;
- Select the program to modify from the list;
- Modify the program settings;
- Press the Update button.
To delete a program:
- Select the Pruduct type;
- Select the program to modify from the list;
- Press the Delete button.
Manage Program Functions
To functions to the selected program:
- Select the Program type;
- Select the program from the list;
- Select the function to assign;
- Insert or clear the funtion value;
- Press the Ok button.
Manage Program Verifies
From the program panel it's possible to manage the verifies only if are enabled from the configuration file.
For each verify must be inserted the following informations:
- Type: The type of test: selected interval in the range or point in the range;
- Probe: the probe number in the format “1xx”;
- Trigger (°C): The temperature trigger of tre verify;
- Time from trigger (min.) The wait time, in minutes, after reaching the trigger for the start of the verification;
- Interval (min.) The duration of the test in minutes;
- Setpoint (°C) The temperature setpoint to reach in the interval;
- Temperature range (°C) The acceptable range of temperature in the range.

To add a new verify in the selected program:
- Select the Product type;
- Select the program from the list;
- Press the Add button;
- Insert the verify informations;
- Press the Confirm button.
To modify a verify:
- Select the Product type;
- Select the program from the list;
- Select the verify;
- Press the Modify button;
- Modify the data;
- Press the Confirm button.
To delete a verify:
- Select the Product type;
- Select the program from the list;
- Select the verify;
- Press the Delete button.
Activities
In the archive of the activities you can define the tasks to be performed during the cycles of the card test.
To open the management window select Archive → Activities definitions from the menù.

To add a new verify:
- Select the Product type;
- Press the New button;
- Insert the activity description and load a symbolic image from file (16×16 recommended);
- Press the Update button.
To modify an existing activity:
- Select the Product type;
- Select the activity to modify from the list;
- Modify the activity description and also, if nedeed, the symbolic image;
- Press the Update button.
To delete an existing activity:
- Select the Product type;
- Select the activity to delete from the list;
- Press the Delete button.
Cards
A test card includes a list of the programs contained in the product under test as well as a list of possible activities that the operator must perform during the start cycle.
To open the management window select Archive → Cards definitions from the menù.

Each test card includes the following information:
- Card name : name assigned to the card;
- Cycle number : total number of expected cycles used for the print preview of the report and the cycle programming;
- Programs list : list of programs that the operator will have to select sequentially each start of the cycle;
- Activities list : activities that operator must performs with its rhythms and repetitions.
To create a new test card:
- Select the Product type;
- Press the New button;
- Insert the name to assign to the new card end insert the cycle number;
- Press the Update button.
To modify an exixting card:
- Select the Product type;
- Select the card to modify from the list;
- Modify the name and/or the cycles number;
- Press the Update button.
To delete an exixting card;
- Select the Product type;
- Select the card to delete from the list;
- Press the Delete button.
Programs of the Card into the Archive
In the Programs panel it's possible to modify the programs assigned to a selected card.
To add a new program to the test card:
- Select the Product type;
- Select the test card;
- Select from the right list the program to add;
- Press the Add button.
To remove a program from a test card:
- Select the Product type;
- Select the test card;
- Select the program to remove from the left list;
- Press the Delete button.
To modify the position of the program in the card sequenze:
- Select the Product type;
- Select the test card;
- Select the program from the left list;
- Press the
 button to move up or
  to move down.


Activities of the Cards into the Archive
In the Activities panel it's possible to modify the activities planned into a selected card.
For each activity it's necessary to insert the following informations:
- Start cycle: The number of the first cycle in which the activity must be done;
- Repeat: How many time the activity must be repeated;
- Steps: The number of cycles between each execution of the activity and the subsequent.
To add a new activity to the test card:
- Select the Product type;
- Select the test card;
- Select from the right list the activity to add;
- Insert the requested parameters;
- Press the Add button.
To remove an activity from a test card:
- Select the Product type;
- Select the test card;
- Select the activity to remove from the left list;
- Press the Delete button.
Inputs Definitions
In this archive the operator must insert the most common definitions of inputs to be used later in the configurations inputs, depending on the type of product.
To open the management window select Archive → Inputs definitions from the menù.

For each input definition must be supplied the following informations:
- Input type: Channel input type from selectable from a list;
- Description: A short description to assign to the input;
- Color: The color for the inputs into the graph.
To add a new definition:
- Select the Product type;
- Press the New button;
- Insert all requested informations;
- Press the Update button.
To modify an existing definition:
- Select the Product type;
- Select the element from the list;
- Modify required informations;
- Press the Update button.
To delete an input definition:
- Select the Product type;
- Select the element to delete from the list;
- Press the Delete button.
Inputs Configuration
It's possible to create inputs configurations that once loaded into a place speeds the modify of the selected inputs.
To open the management window select Archive → Configurations from the menù.

To create a new configuration:
- Select the Product type;
- Press the New button;
- Insert a name fpr the configuration;
- Press the Update buttun;
To modify the name of the configuration:
- Select the Product type;
- Select the configuration from the list;
- Modify the name;
- Press the Upate button;
To delete a configuration:
- Select the Product type;
- Select the configuration to delete from the list;
- Press the Delete button.
Inputs Channels Management of the Configuration
To add an input into the configuration:
- Select the product type;
- Select the configuration from the list;
- Select the inputs definition to add from the right list;
- Press the Add button;
To remove an existing input:
- Select the product type;
- Select the configuration from the list;
- Select the inputs to remove from the left list;
- Press Remove.
To manage the inputs definition list press the Open button (please see the previous paragraph).
Operators
The operators con only be managed from existing with administrators capabilities operators.
To open the management window select Archive → Operators from the menù.

Once opened the window all existing operators will be visible into the list. To show only one or parts of the archive, use the input text fields to insert search criteria and press Refresh button.
For each operator it's necessary to insert the following informations:
- Code: A numeric code of 3 numbers used for login;
- Operator: Operator name;
- Type: The operator capabilities (administrator or user).
To add a new operator:
- Press the New button;
- Insert the requested data into the new opened panel;

- Press the Ok button.
To modify an existing operator:
- Select the operator to modify from the list;
- Press the Modify button;
- Modify the operator;
- Press the Ok button.
To delete an operator:
- Select the operator to delete from the list;
- Press the Delete button.
it will not be the same as before.
Options
The option management panels is reachable selecting File → Options from main menù.

Digital Input Options
The options in this panel will be used only if the sistem is configured to use digital inputs. The operator can:
- Enable or disable the beep sound when the system detect the contact of digital inputs used as alarm;
- Set the interval in seconds between each beep and the next during a state of alarm.
Print Tools
The application provides various printing features some accessible from the main menu and other from the cycles display window.
Print Test Card
It's possible to print the test card from the main screen using one of the following methods:
- select the place with the right button of the mouse and choose Place → Print → Card from popup menù;
- select the place with the left button of the mouse and press the following button from the main toolbar;

The report contain the data of the product in exam and the details of all the programs inserted into the test card.
Print Test Report
It's possible to print the test report of all executed cycles from the main screen using one of the following methods:
- select the place with the right button of the mouse and choose Place → Print → Report from popup menù;
- select the place with the left button of the mouse and press the following button from the main toolbar;

The report contain the informations of the product in exam and the details of all executed cycles.
Print Excel Report
It's possible to print the Excel report from the main screen using one of the following methods:
- select the place with the right button of the mouse and choose Place → Print → Report XLS from popup menù;
- select the place with the left button of the mouse and press the following button from the main toolbar;
Print Activities Planning
From the main window it's possible to print a planning of the activities (cycles) to do.
- Select File → Print activities from main menù.

After entering the parameters, it will print a forecast cycles and activities to be performed for all stations with active tests. The parameters are:
- Daily or Weekly: how many days the report should take into consideration. If you select the weekly , you must also set the number of days (2 to 7);
- Cycles a day : If enabled, you can set the number of cycles per day that an operator can perform. Otherwise, an average will be calculated based on the cycles already performed for each station.
Print Cycle Report
From the executed cycles window it's possible to print the test report of a selected cycle following this steps:
- select from the list the cycle to print;
- press the following button from the toolbar;
The report contain the informations of the product in exam and the details of the selected cycles with also the viewed graph.
Place Inputs Values
The window displays the first list with the inputs values of the selected workstation and the second list with the inputs values of the line to which the station belongs.

Sound Notifications
The sound notifications are a function can be used if you have one or more digital inputs. You can enable this feature using the Options window.
When the notify is enabled, it's possible to silence it using one of this mothods:
- selecting File→ Break beep notify from main menù;
- using the following button from the toolbar:
Events
In the event windows, you can see all the errors that have occurred while running the application.
To open the panel, follows one of these methods:
- Select File → Log from the main menù;
- Press the following button from the main toolbar:

For each event the software displays the type: error, warning, or information, the date and time at which it occurred and the message. To view the event details use mouse double click.

To clear all events press the Empty button from the toolbar.
Scanner and Handheld Management
CQ_FX_WIFI includes the use of handheld Datalogic Elf ® and scanner Dragon ® through which you can perform the most common functions and routines directly from the test stations.


The connection settings and configuration are stored in CQ_FX.exe.config. The key COM_SCANNER identifies the serial port to which the scanner is connected to the RF base while the numbers in the key SCANNER_BARCODE_SETTINGS identifying respectively:
- barcode product lenght;
- model code start position;
- model code lenght;
- serial number start position;
- serial number code length;
- decode number start position.
To enable Elf ® devices management instead it's necessary to configure the listening port in the UDP_SEVER_PORT key. Of course, the settings for bar codes reading are the same of those configured for the scanner Dragon.
In the program there is a function for importing new products from a Excel worksheet that is activated when reading a model number that is not on the archive both with Dragons and Elf player. To use the function it is necessary that the file “Importa.XLS” with the list of models is in the same folder of the application executable and also some keys must be configured as in the following example:
    <add key="IMPORTA_FOGLIO" value="[Foglio1$]"/>
    <add key="IMPORTA_COLONNA_CODICE" value="[Codice Modello]"/>
    <add key="IMPORTA_COLONNA_DESCRIZIONE" value="[Descrizione Modello]"/>
The following paragraph of this chapter describes the features of the Datalogic Dragon ®, for the use of handheld refer to the CQ_FX_Mobile manual.
Operator Login
You can login into the system reading with the barcode reader your operator card, or entering the three digit code with the scanner buttons. To login from keyboard:
- Press any key to start up the scanner and go to “system ready” screen;
MAREL
Italy
<LOGIN>
- Press the right button <LOGIN>;
>OPERATOR<
>000<
>^ <
←1> <OK> <+1>
- Press < -1> or <+1> per decrease or increase the number highlighted by the ^ character and press <OK> to confirm and go to the next digit. Once the code is completed, press <OK> again to login.
>AUTHENTICATED<
Operator1
<LOGOUT>
Operator Logout
If you need to use the scanner with a different operator:
- From the authenticated operator screen, press the <LOGOUT> button to come back to “system ready” screen.
MAREL
Italy
<LOGIN>
Load a Product
You can load a product in a free place with the scanner.
- Read the barcode of the (free) place;
linea1/1 EMPTY
>BARCODE<
- Read the barcode of the product to load. If the model code is not in the products archive, the application will tries to find the code in the file “Import.xls”. If the code cannot be found, the application will show a warning. If the code is found, you need to select the product type;
>I M P O R T <
>PRODUCT TYPE<
1/2:Oven
>PRODUCT TYPE<
1/1:Oven
- Change the product type with the arrow keys, and confirm with the central button to move to the next step (test card selection);
line1/1
> TEST CARD <
2/2:(CARD N. 1)
- You can move between test cards with the arrow keys, and confirm with the central button to move to the next step (production line selection);
line1/1
> PROD. LINE <
<CAN> <OK>
- Read the line code with the barcode reader and press <CAN> to undo or <OK> to confirm.
Start a Cycle
- To start a cycle, read the place barcode. Only if there are activities to execute, the terminal will shows a screen to confirm, skip or cancel them;
21 STOP
cleaning
<YES> 1/2 <NO>
<REMEMBER>
- Press <YES> to confirm the current activity, <NO> to undo or otherwise <REMEMBER> to skip it;
line1/02 CLOSED
40:Fast220
21/21
21 STOP
- Press the central button to confirm the planned cycle, or use the arrow keys to change the cycle to execute. If temperature and cooking time are different than 0, you can change them before start the cycle:
Stat.250+V
Temperature
←10> 250 <+10>
- Press < -10> or <+10> to change the Temperature or the Cooking Time and press the central button to confirm;
Stat.250+V
<NEW S.>
<OK> <CAN>
- Press <OK> to start the cycle, or <CAN> to undo. If you have selected a different cycle of the planned one, with the <NEW S.> you can start the cycle and a new test sequence.
Close or Break a Cycle
- Read the place barcode;
line1/02 ACTIVE
21 STOP
<BREAK> <CLOSE>
- Press the <BREAK> button to break the cycle or <CLOSE> to close and save the cycle.
line1/02 ACTIVE
BREAK TEST
<CONFIRM>
- Confirm with <CONFIRM> button, otherwise press any other key.