Marel TC Test Gas
Preface
Introduction
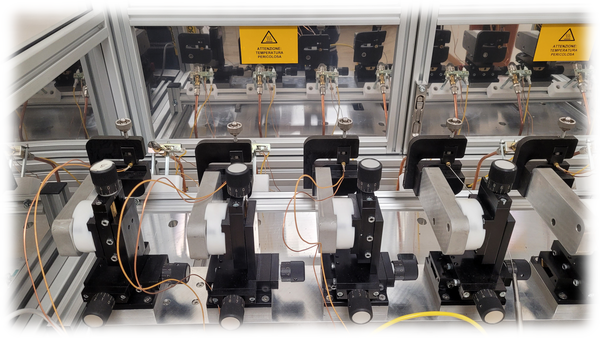
MarelTCTestGas is an application for testing gas hobs safety thermocouples. The software is intended to use with the Marel special bench.
Interface
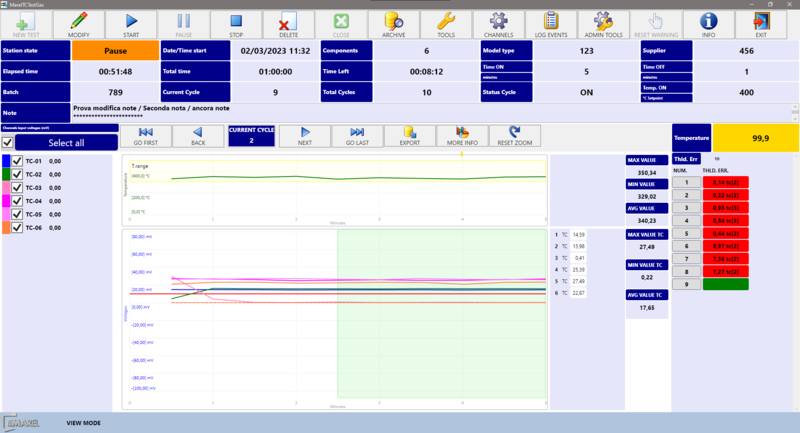
The main window of the application is as follow:
Next sections describe in detail all main window components.
Menu and toolbar
The table shows all the buttons present in the toolbar with the relative function:
Current/Archieved test details
This area show the current active test or archieved details:
Station state : current test state
| State | Description |
|---|---|
| EMPTY | Station is empty. No current test loaded |
| READY | Test is ready to start for the first time |
| PAUSE | Test in in pause. Ready to continue |
| RUNNING | Test is in running state according with cycles Time On, Time OFF and cycles defined |
| COMPLETED | Test is completed. All the cycles are executed |
| STOPPED | Test is definitively interrupted by operator. It could not continue |
| ERROR/ALARM | Current test is in error state. Please check the LOG to verify the problem. Test can continue once the problem is solved after that operator press PLAY again |
Components : number of the components in test.
Model type, Supplier, Batch : components details specified by operator for search purpose once archived.
Elapsed time : elapsed time from the beginning.
Total time : test duration according with Time ON, Time OFF and inserted cycles.
Time left: time left until end.
Time ON: cycle warm time (minutes).
Time OFF: cycle cooling time (minutes).
Current cycle : current running cycle.
Total cycles : total cycles of the test.
Status cycle : ON in case of the system is warming the thermocouples, OFF during the time OFF period.
Temperature : setpoint temperature used to manage test fault and TC acquired voltages verifies.
Comp.T : current temperature in TC connection with gas taps component.
Note: additional test notes.
Immediately below, on the right the software show the currently acquired temperature from the system thermocouple
Test TC details
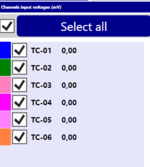
When there is current defined test or a test is loaded from archive the software shows the lists of the defined thermocouples.
From the list the operator can show/hide the thermocouple diagrams selecting or deselecting the checkbox. Also he can change color with mouse click on coloured rectangle (default is black) on the right. When test is in RUNNING state the software show the last read value for thermocouple.
Cycle values diagram
In the center of the screen the operator can see the diagram of the current cycle or a different selected already executed.
There are two diagrams: the first on the top is the Temperature diagram. It show the test temperature acquired with the system temperature thermocouple. The upper and lower lines delimit the accepted temperature range to consider the acquired values millivolts good for test results.
The second graphic area show the diagram of the termocouple generated millivolts. The green area delimits the range used to verify generated millivolts. The area in in percentage from the end of the cycle to avoid to take data during the warming phase at the beginning of the cycle. When the mouse is over the graph, a red bar show the selected read and the acquired value are showed in the right: TC is the main value; In the right for each graph the software show the maximum, average and minimum acquired values for the showed diagrams.
For the test with a minimum threshold defined, the software show a red horizontal line to highlight the minimum acceptable read TC value.
Test toolbar
The second toolbar in middle of the screen must be used for current test functions:
GO FIRST : show the detail of the first cycle.
BACK : select the previous cycle.
NEXT : select the next cycle.
GO LAST : select the last cycle (completed or actual running).
EXPORT : export the data of the selected cycle as CSV file.
MORE INFO : show a new panel with current test details and cycles averages. Please check Test details window paragraph.
RESET ZOOM : restore default diagram settings.
Cycles list details
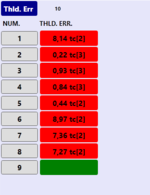
When there is a test defined in the right of the screen a list with all executed cycles will be visible:
At the top of the list there is the TC millivolt threshold min value THLD ERR. and below for each cycle the software show the number wit a green or red box. If at the end of the cyce all thermocouples are over the limit, the box will be green otherwise red. The value inside the box is the number and millivolt of the first component with TC value less then threshold.
To go directly to the cycle, click on the number to see graph and details.
Create new test
From the main menu bar select New test
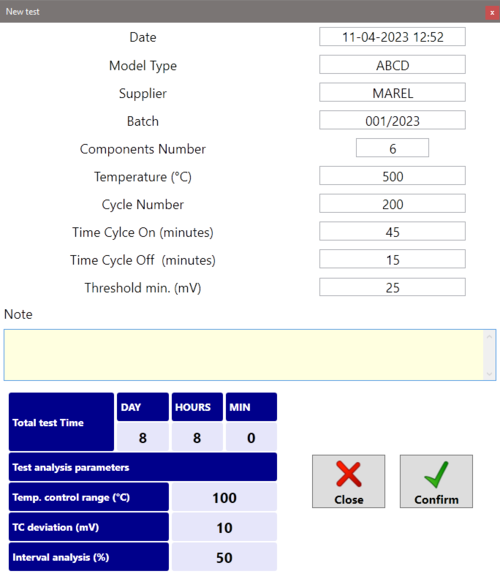
to open the test definition panel:
Insert the thermocoples specification:
model type, supplier, batch (production lot etc…).
Insert the test settings:
Components Number : number of the connected thermocouples;
Temperature (°C) : system target setpoint temperature for TC sensors.
Cycle number : number of the cycles to execute.
Time Cycle On (minutes) : duration of the time on step (warming time).
Time Cycle Off (minutes) : duration of the time off step (cooling time).
Threshold min. (mV) : minimum acceptable voltage for goods thermocouples.
Once filled up the fields, confirm with OK. The station state will become READY.
Components installation
Before start a test it's necessary to verify that all thermocouples are correctly positioned and also the system is reading the correct generated millivolts. So operator has to open the settings panel selecting Channels button from menu ![]() .
.
Start test
When station state is READY once created new test, the operator has to close the safety door and after press the button
In case that an error occur during start or the door is not closed, a warning message will be showed and the test will go in ERROR/ALARM otherwise the station will go in RUNNING state.
Pause test
In RUNNING state state press the button
to switch the state in PAUSE. If the software is performing a time ON step, will stop to warm up the thermocouples and also the gas taps if specified during startup.
Stop test
In case it's necessary to close the test before the scheduled end, the operator has to press the button
Once pressed the software will stop to acquire data and station will go in STOPPED state.
Delete test
In case it's necessary to definitively delete the test before the scheduled end, the operator has to press the button
Once pressed the software will ask the operator to config to discard current test.
Close test
Once the test is COMPLETED or STOPPED or DELETED, to prepare the system for a new test going in EMPTY state, the operator can press the button
Software test settings
Some system setting can be customized by the operator and are saved to avoid to insert each time a new test is defined. To modify this settings, the operator must open the tools panel pressing the button
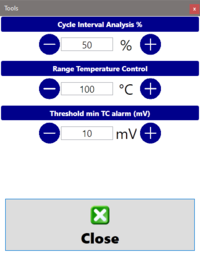
The software will show the following panel
Cycle Interval Analysis % : this value define the last time in percent of the total ON period taken as valid to calculate averages and verify thermocouples working parameters. This period is highlighted as green in the graph.
Range temperature control °C : it defines the difference from the target setpoint to consider the data acquired as valid for test. In case that for any reason the temperature is lower or higher than delimited range within Cycle Interval Analysis period, the acquired data are marked as not valid to avoid to recognize as thermocouples fault.
Threshold min TC alarm (mV) : with a test running, if one ore more acquired thermocouples millivolts is lower than this threshold, the system fill start to blink the BLUE lamp to signal a possible TC problem.
Channels window
During setup phase or during test execution, the operator pressing the button
can open the panel to see the values of all defined system inputs and other system signals
System temparature : the test bench use this central sensor to verify that the system is working properly and also to compare the acquired millivolts of the connected thermocouples..
Auxiliary temperature : in the test bench there is an other additional auxiliary thermocouple input that could be used by operator during installation procedure or for any other purpose. It is not mandatory and could be also disconnected during test phase.
Components voltages: this box contain all the system defined thermocouples inputs : one input for each to read main generated millivolts.
Motor sensors : there are three defined inputs as explained in below table to signal the thermocoule sliding support position :
| Signal | Description |
|---|---|
| FRONT POSITION | GREEN light when is in WARM position (front), GRAY in case of front position sensor is not detected |
| BACK POSITION | GREEN light when is in COLD position (back), GRAY in case of back position sensor is not detected |
| OVER COURSE | RED when the system recognize an over course position detected, GRAY in normal working mode |
System signals : there are three defined inputs as explained in below table:
| Signal | Description |
|---|---|
| SAFETY BARRIER | YELLOW light when the barrier recognizes a WARNING state that break the automatic slide movement, GRAY in ca se of normal working mode |
| BYPASS DOOR SENSOR | YELLOW light if bypass is activated, GRAY when bypass is not active. |
| SAFETY DOOR SENSOR | YELLOW light when the system recognize that the safety door/panel is closed, GRAY when the door/panel sensors are not recognized as closed |
Thermocouples position : operator can press the following buttons to move front or back the sliding support:
Move Front: perform an automatic movement to reach the Front position Move Back: perform an automatic movement to reach the back position
Once pressed, the operator has to wait the end of the movement. In case of hardware problems the MOVEMENT TIMEOUT light will become RED. It is possible to retry movements also with MOVEMENT TIMEOUT signal. In case verify if there are obstacles between barriers that inhibits the movement.
Open log viewer
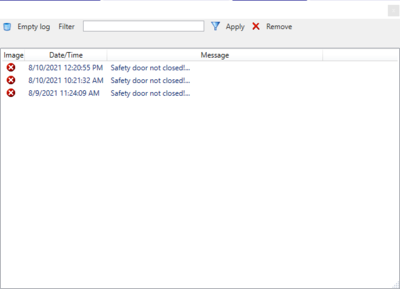
Problems occurred during software execution are storend into a text file. The content can be managed pressing the button
In the show panel there are the following tools:
Open archieved test
All the executed test are stored into the archive. To view graph and data of a completed test it's necessary to load it from archive. Operator must press the button
and after in the showed panel will be possible to search the test for some inserted data or execution date interval
Click on Search button, select the test from the list end double click on it or press the Load button.
The software will show a new window with the details of the executed test similar to the main windows. The operator could navigate through the cycles and also view test details as for currently running test.
Test details window
From main window is possible to see the list of executed cycles but the graph and averages of only one cycle at time. To see the averages and minimum acquired values of the thermocouples millivolts the operator must press the button More Info
Once pressed the program shows a new window
Differently from main screen where X axis was the minutes from the start of the cycle, here the X axis represent the number of the cycle. So the two lines are the result of the minimum values and average values (millivolts) sampled in each cycle.
Instead for the first test temperature graph on the top, the two lines represent the min and max in the cycle.
When the mouse is over the graph area, is possible to see the values in the highlighted cycle. The graph can be panned or zoomed with mouse wheel.
Three buttons are available as in the following table:


